X
wikiHow is a “wiki,” similar to Wikipedia, which means that many of our articles are co-written by multiple authors. To create this article, volunteer authors worked to edit and improve it over time.
This article has been viewed 63,564 times.
Learn more...
This article shows, step-by-step, how to create a graph in Microsoft Office Word 2007.
Steps
-
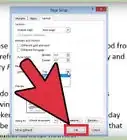
1Go to the Insert tab. It is the tab directly to the right of the Home tab.
-
2Click on Chart, until Illustrations.
-
3Click on the different categories and scroll down to view types of graphs. They have much more than graphs--including tables, charts, and scatter plots. The categories are: Column, Line, Pie, Bar, Area, X Y (Scatter), Stock, Surface, Doughnut, Bubble, and Radar.
-
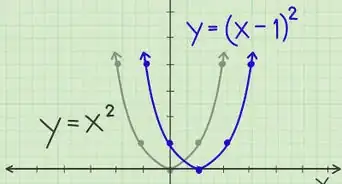
4Suppose you choose a Line Graph. Click on the Line tab, and choose how you want your graph to look like. They have different options.
-
5When you choose your graph and how you want it to look, another window will appear. It will be a spreadsheet--Microsoft Excel--all still inside the Word document. You should see Categories 1-4 and Series 1-3. Change them to change your data.
-
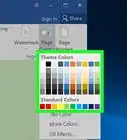
6Within this window, there will be several more tabs: Home, Insert, Page Layout, Formulas, Data, Review, and View. You can use the Home tab to change the text--as far as fonts and colors. Play around with some of the other tabs for more options.
-
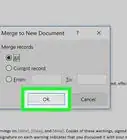
7Simply x out of the Excel window and you'll return to Microsoft Word. Your customized graph will appear.


Community Q&A
-
QuestionHow do I make a straight line?
 Community AnswerUse a ruler or any other straight object. Just place the ruler down on your paper and run the pencil along the edge to make your line.