Countries by HDI-rating
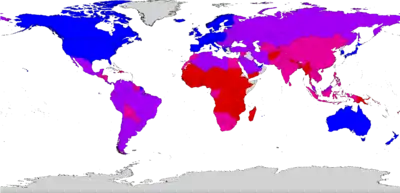
| Template:Legend Template:Legend Template:Legend | Template:Legend Template:Legend |
This is a list of all countries by Human Development Index as included in a United Nations Development Program's Human Development Report released on 4 November 2010, compiled on the basis of estimates for 2010. It covers 168 UN member states (out of 192) and Hong Kong. Twenty four UN member states are not included due to lack of data. The average HDI of regions of the World and groups of countries are also included for comparison.
The Human Development Index (HDI) is a comparative measure of life expectancy, literacy, education and standards of living for countries worldwide. It is a standard means of measuring well-being, especially child welfare. It is used to distinguish whether the country is a developed, a developing or an under-developed country, and also to measure the impact of economic policies on quality of life. The index was developed in 1990 by Pakistani economist Mahbub ul Haq and Indian economist Amartya Sen.[1]
Countries fall into four broad human development categories, each of which comprises 42 countries (except for the second category, comprising 43 countries)[2]. The divisions are:
| Division | comprising: |
| Very high | 42 countries |
| High | 43 countries |
| Medium | 42 countries |
| Low | 42 countries |
Due to the new methodology adopted in 2010 HD Report, its HDI figures appear lower than the HDI figures in previous reports.
Starting in the report for 2007, the first category is referred to as developed countries, and the last three are all grouped in developing countries. The original "high human development" category has been split into two as above in the report for 2007.
Some older groupings (high/medium/low income countries) have been removed that were based on the gross national income (GNI) in purchasing power parity (PPP) per capita, and have been replaced by another index based on the gross domestic product (GDP) in purchasing power parity per capita.
Complete list of countries


- Similar HDI values in the current list do not lead to ranking ties, since the HDI rank is actually determined using HDI values to the sixth decimal point.
- This revision of the index was released on 4 November 2010 and estimates the HDI of countries for 2010.
- The number in brackets represents the number of ranks the country has climbed (up or down) relative to the revised estimates for 2007, released on 5 October 2009.
Very high human development (developed countries)
Template:Col-begin Template:Col-break
| Rank | Country | HDI | ||
|---|---|---|---|---|
| New 2010 estimates for 2010 [3] |
Change compared to old 2009 values for 2007 | New 2010 estimates for 2010 [3] |
Change compared to new 2010 estimates for 2009 [3] | |
| 1 | finflag | 0.938 | ||
| 2 | finflag | 0.937 | ||
| 3 | finflag | 0.907 | ||
| 4 | finflag | 0.902 | ||
| 5 | finflag | 0.895 | ||
| 6 | finflag | 0.891 | ||
| 7 | finflag | 0.890 | ||
| 8 | finflag | 0.888 | ||
| 9 | finflag | 0.885 | ||
| 10 | finflag | 0.885 | ||
| 11 | finflag | 0.884 | ||
| 12 | finflag | 0.877 | ||
| 13 | finflag | 0.874 | ||
| 14 | finflag | 0.872 | ||
| 15 | finflag | 0.872 | ||
| 16 | finflag | 0.871 | ||
| 17 | finflag | 0.869 | ||
| 18 | finflag | 0.867 | ||
| 19 | finflag | 0.866 | ||
| 20 | finflag | 0.863 | ||
| 21 | finflag | 0.862 | ||
Template:Col-break
| Rank | Country | HDI | ||
|---|---|---|---|---|
| New 2010 estimates for 2010 [3] |
Change compared to old 2009 values for 2007 | New 2010 estimates for 2010 [3] |
Change compared to new 2010 estimates for 2009 [3] | |
| 22 | finflag | 0.855 | ||
| 23 | finflag | 0.854 | ||
| 24 | finflag | 0.852 | ||
| 25 | finflag | 0.851 | ||
| 26 | finflag | 0.849 | ||
| 27 | finflag | 0.846 | ||
| 28 | finflag | 0.841 | ||
| 29 | finflag | 0.828 | ||
| 30 | finflag | 0.824 | ||
| 31 | finflag | 0.818 | ||
| 32 | finflag | 0.815 | ||
| 33 | finflag | 0.815 | ||
| 34 | finflag | 0.812 | ||
| 35 | finflag | 0.810 | ||
| 36 | finflag | 0.805 | ||
| 37 | finflag | 0.805 | ||
| 38 | finflag | 0.803 | ||
| 39 | finflag | 0.801 | ||
| 40 | finflag | 0.795 | ||
| 41 | finflag | 0.795 | ||
| 42 | finflag | 0.788 | ||
Template:Col-end
High human development (developing countries)
Template:Col-begin Template:Col-break
| Rank | Country | HDI | ||
|---|---|---|---|---|
| New 2010 estimates for 2010 [3] |
Change compared to old 2009 values for 2007 | New 2010 estimates for 2010 [3] |
Change compared to new 2010 estimates for 2009 [3] | |
| 43 | finflag | 0.784 | ||
| 44 | finflag | 0.783 | ||
| 45 | finflag | 0.783 | ||
| 46 | finflag | 0.775 | ||
| 47 | finflag | 0.771 | ||
| 48 | finflag | 0.769 | ||
| 49 | finflag | 0.769 | ||
| 50 | finflag | 0.767 | ||
| 51 | finflag | 0.767 | ||
| 52 | finflag | 0.765 | ||
| 53 | finflag | 0.755 | ||
| 54 | finflag | 0.755 | ||
| 55 | finflag | 0.752 | ||
| 56 | finflag | 0.750 | ||
| 57 | finflag | 0.744 | ||
| 58 | finflag | 0.743 | ||
| 59 | finflag | 0.736 | ||
| 60 | finflag | 0.735 | ||
| 61 | finflag | 0.732 | ||
| 62 | finflag | 0.725 | ||
| 63 | finflag | 0.723 | ||
| 64 | finflag | 0.719 | ||
Template:Col-break
| Rank | Country | HDI | ||
|---|---|---|---|---|
| New 2010 estimates for 2010 [3] |
Change compared to old 2009 values for 2007 | New 2010 estimates for 2010 [3] |
Change compared to new 2010 estimates for 2009 [3] | |
| 65 | finflag | 0.719 | ||
| 66 | finflag | 0.714 | ||
| 67 | finflag | 0.713 | ||
| 68 | finflag | 0.710 | ||
| 69 | finflag | 0.710 | ||
| 70 | finflag | 0.702 | ||
| 71 | finflag | 0.701 | ||
| 72 | finflag | 0.701 | ||
| 73 | finflag | 0.699 | ||
| 74 | finflag | 0.698 | ||
| 75 | finflag | 0.696 | ||
| 76 | finflag | 0.695 | ||
| 77 | finflag | 0.695 | ||
| 78 | finflag | 0.694 | ||
| 79 | finflag | 0.689 | ||
| 80 | finflag | 0.688 | ||
| 81 | finflag | 0.683 | ||
| 82 | finflag | 0.681 | ||
| 83 | finflag | 0.679 | ||
| 84 | finflag | 0.677 | ||
| 85 | finflag | 0.677 | ||
Template:Col-end
Medium human development (developing countries)
Template:Col-begin Template:Col-break
| Rank | Country | HDI | ||
|---|---|---|---|---|
| New 2010 estimates for 2010 [3] |
Change compared to old 2009 values for 2007 | New 2010 estimates for 2010 [3] |
Change compared to new 2010 estimates for 2009 [3] | |
| 86 | finflag | 0.669 | ||
| 87 | finflag | 0.669 | ||
| 88 | finflag | 0.663 | ||
| 89 | finflag | 0.663[4] | ||
| 90 | finflag | 0.659 | ||
| 91 | finflag | 0.658 | ||
| 92 | finflag | 0.654 | ||
| 93 | finflag | 0.648 | ||
| 94 | finflag | 0.646 | ||
| 95 | finflag | 0.643 | ||
| 96 | finflag | 0.640 | ||
| 97 | finflag | 0.638 | ||
| 98 | finflag | 0.633 | ||
| 99 | finflag | 0.623 | ||
| 100 | finflag | 0.622 | ||
| 101 | finflag | 0.620 | ||
| 102 | finflag | 0.617 | ||
| 103 | finflag | 0.614 | ||
| 104 | finflag | 0.611 | ||
| 105 | finflag | 0.606 | ||
| 106 | finflag | 0.604 | ||
Template:Col-break
| Rank | Country | HDI | ||
|---|---|---|---|---|
| New 2010 estimates for 2010 [3] |
Change compared to old 2009 values for 2007 | New 2010 estimates for 2010 [3] |
Change compared to new 2010 estimates for 2009 [3] | |
| 107 | finflag | 0.602 | ||
| 108 | finflag | 0.600 | ||
| 109 | finflag | 0.598 | ||
| 110 | finflag | 0.597 | ||
| 111 | finflag | 0.589 | ||
| 112 | finflag | 0.580 | ||
| 113 | finflag | 0.572 | ||
| 114 | finflag | 0.567 | ||
| 115 | finflag | 0.565 | ||
| 116 | finflag | 0.560 | ||
| 117 | finflag | 0.538 | ||
| 118 | finflag | 0.534 | ||
| 119 | finflag | 0.519 | ||
| 120 | finflag | 0.502 | ||
| 121 | finflag | 0.498 | ||
| 122 | finflag | 0.497 | ||
| 123 | finflag | 0.494 | ||
| 124 | finflag | 0.494 | ||
| 125 | finflag | 0.490 | ||
| 126 | finflag | 0.489 | ||
| 127 | finflag | 0.488 | Template:Col-end | |
Low human development (developing countries)
Template:Col-begin Template:Col-break
| Rank | Country | HDI | ||
|---|---|---|---|---|
| New 2010 estimates for 2010 [3] |
Change compared to old 2009 values for 2007 | New 2010 estimates for 2010 [3] |
Change compared to new 2010 estimates for 2009 [3] | |
| 128 | finflag | 0.470 | ||
| 129 | finflag | 0.469 | ||
| 130 | finflag | 0.467 | ||
| 131 | finflag | 0.460 | ||
| 132 | finflag | 0.451 | ||
| 133 | finflag | 0.439 | ||
| 134 | finflag | 0.435 | ||
| 135 | finflag | 0.435 | ||
| 136 | finflag | 0.433 | ||
| 137 | finflag | 0.431 | ||
| 138 | finflag | 0.428 | ||
| 139 | finflag | 0.428 | ||
| 140 | finflag | 0.428 | ||
| 141 | finflag | 0.427 | ||
| 142 | finflag | 0.423 | ||
| 143 | finflag | 0.422 | ||
| 144 | finflag | 0.411 | ||
| 145 | finflag | 0.404 | ||
| 146 | finflag | 0.403 | ||
| 147 | finflag | 0.402 | ||
| 148 | finflag | 0.398 | ||
Template:Col-break
Template:Col-end
| Rank | Country | HDI | ||
|---|---|---|---|---|
| New 2010 estimates for 2010 [3] | Change compared to old 2009 values for 2007 | New 2010 estimates for 2010 [3] | Change compared to new 2010 estimates for 2009 [3] | |
| 149 | finflag | 0.397 | ||
| 150 | finflag | 0.395 | ||
| 151 | finflag | 0.390 | ||
| 152 | finflag | 0.385 | ||
| 153 | finflag | 0.385 | ||
| 154 | finflag | 0.379 | ||
| 155 | finflag | 0.349 | ||
| 156 | finflag | 0.340 | ||
| 157 | finflag | 0.328 | ||
| 158 | finflag | 0.317 | ||
| 159 | finflag | 0.315 | ||
| 160 | finflag | 0.309 | ||
| 161 | finflag | 0.305 | ||
| 162 | finflag | 0.300 | ||
| 163 | finflag | 0.295 | ||
| 164 | finflag | 0.289 | ||
| 165 | finflag | 0.284 | ||
| 166 | finflag | 0.282 | ||
| 167 | finflag | 0.261 | ||
| 168 | finflag | 0.239 | ||
| 169 | finflag | 0.140 | ||
References
- ↑ "History of the Human Development Report". United Nations Development Programme. Retrieved 26 March 2009.
- ↑ "2010 Human development Report". United Nations Development Programme. p. 139. Retrieved 4 November 2010.
- 1 2 3 4 5 6 7 8 9 10 11 12 13 14 15 16 17 18 19 20 21 22 23 24 "2010 Human development Report". United Nations Development Programme. pp. 148–151. Retrieved 4 November 2010.
- ↑ Includes the data for Taiwan."History of the Human Development Report". United Nations Development Programme. Retrieved 26 March 2009.